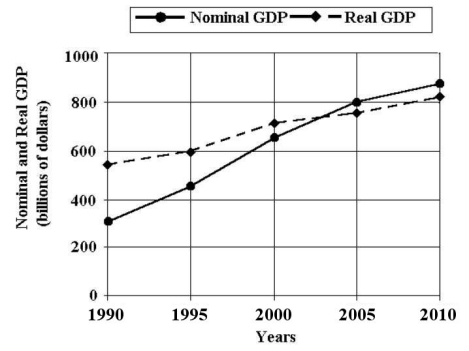
 FIGURE 20-1 Refer to Figure 20-1.Real GDP increased by approximately ________% between 1995 and 2010.
A) 9
B) 17
C) 35
D) 52
E) 75
Correct Answer:
Verified
Q95: The table below shows the total output
Q96: The table below shows total output for
Q97: The table below shows total output for
Q98: The table below shows total output for
Q99: The table below shows the total output
Q101: Measures of GDP may understate the economic
Q102: Which of the following is excluded from
Q103: Consider Canada's GDP deflator and Consumer Price
Q104: Consider the following statement: "An increase in
Q105: One major reason that GDP is an
Unlock this Answer For Free Now!
View this answer and more for free by performing one of the following actions

Scan the QR code to install the App and get 2 free unlocks

Unlock quizzes for free by uploading documents