The table below provides macroeconomic data for a hypothetical economy.Dollar amounts are all in constant-dollar terms. 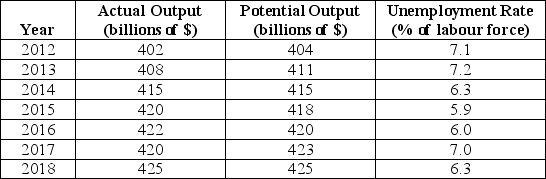 TABLE 19-1 Refer to Table 19-1.What is the output gap in 2013?
A) $408 billion
B) $411 billion
C) $7.1 billion
D) $3 billion
E) -$3 billion
Correct Answer:
Verified
Q28: The table below provides macroeconomic data for
Q29: Consider an output gap where Y <
Q30: Consider short-run fluctuations in real GDP around
Q31: The table below provides macroeconomic data for
Q32: The table below provides macroeconomic data for
Q34: On a graph showing real national income
Q35: Which of the following correctly describes the
Q36: The table below provides macroeconomic data for
Q37: Which of the following correctly describes the
Q38: In the study of short-run fluctuations in
Unlock this Answer For Free Now!
View this answer and more for free by performing one of the following actions

Scan the QR code to install the App and get 2 free unlocks

Unlock quizzes for free by uploading documents