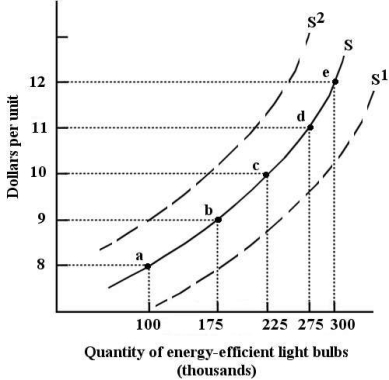
 FIGURE 3-2 Refer to Figure 3-2.The movement along the supply curve,S,from point a to point c,could be caused by
A) a decrease in the price of energy-efficient light bulbs.
B) a decrease in the price of glass,a major input in the production of energy-efficient light bulbs.
C) an increase in the number of suppliers of energy-efficient light bulbs.
D) an increase in the price of energy-efficient light bulbs.
E) a decrease in the price of ordinary light bulbs.
Correct Answer:
Verified
Q84: The supply and demand schedules for the
Q85: The demand and supply schedules for a
Q86: The supply and demand schedules for the
Q87: "Excess demand" can also be described as
A)excess
Q88: The supply and demand schedules for the
Q90: Choose the best description of an "equilibrium
Q91: The supply and demand schedules for the
Q92: At the market-clearing price for a commodity,
A)prices
Q93: A surplus exists in the market when
A)the
Q94: ![]()
Unlock this Answer For Free Now!
View this answer and more for free by performing one of the following actions

Scan the QR code to install the App and get 2 free unlocks

Unlock quizzes for free by uploading documents