Multiple Choice
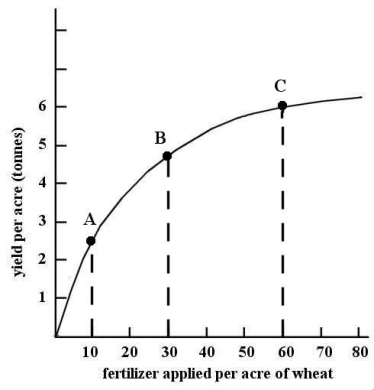 FIGURE 2-4 Refer to Figure 2-4.This non-linear function shows that over the range shown,
A) as more fertilizer is applied,the marginal response in yield is increasing
B) as more fertilizer is applied,the marginal change in yield is diminishing.
C) as the yield per acre increases,the amount of fertilizer required per acre is diminishing.
D) as the yield per acre increases,the amount of fertilizer required per acre is increasing.
E) as more fertilizer is applied,the total yield per acre is diminishing.
Correct Answer:
Verified
Related Questions
Q134: Suppose there is a linear relationship between
Q135: On a coordinate graph with y on

