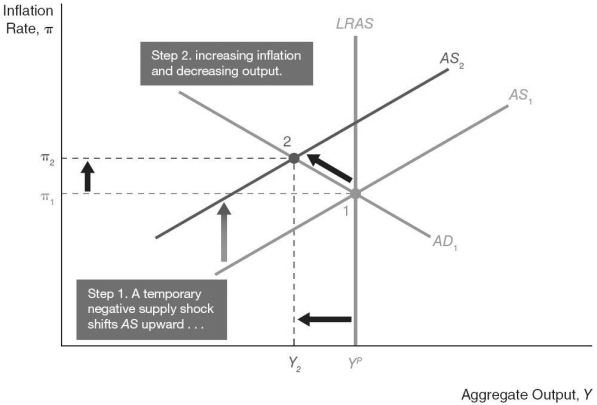
-In the figure above, at point 2, the shift of the aggregate supply curve from AS1 to AS2 is a result of ________ wages that ________ production cost.
A) increasing; increase
B) increasing; reduce
C) decreasing; decrease
D) decreasing; increase
Correct Answer:
Verified
Q57: According to aggregate demand and supply analysis,the
Q66: A theory of aggregate economic fluctuations called
Q66: According to aggregate demand and supply analysis,the
Q68: Because shifts in aggregate demand are not
Q73: According to aggregate demand and supply analysis,the
Unlock this Answer For Free Now!
View this answer and more for free by performing one of the following actions

Scan the QR code to install the App and get 2 free unlocks

Unlock quizzes for free by uploading documents