Use the graphs to answer questions 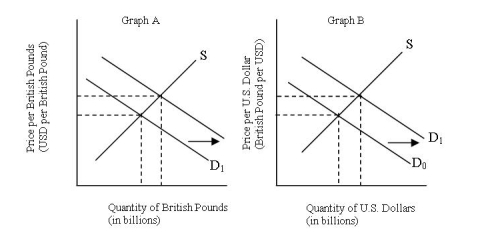
-Which graph illustrates the effects on the appropriate currency when there is an increase in U.S.citizens importing British tea?
A) Graph A
B) Graph B
C) Either Graph A or Graph B
D) Neither Graph A nor Graph B
Correct Answer:
Verified
Q1: One Chinese Yuan Renminbi CNY) costs .1604
Q2: A currency requires more foreign currency to
Q3: A good or service produced domestically but
Q4: Use the graphs to answer questions
Q5: The foreign exchange market is driven by
A)demand.
B)supply.
C)demand
Q7: Your dream vacation includes renting a cottage
Q8: You decide to take a week off
Q9: The rate at which one currency can
Q10: An example of a U.S.export would be
A)a
Q11: The conversion of one country's currency into
Unlock this Answer For Free Now!
View this answer and more for free by performing one of the following actions

Scan the QR code to install the App and get 2 free unlocks

Unlock quizzes for free by uploading documents