Reference: Consider the following graphs for the following question 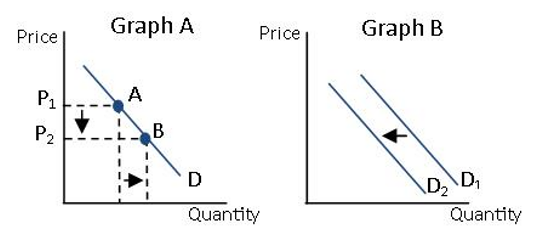
-Refer to the above graphs.Which of the following is represented by Graph B?
A) An increase in consumer income for a normal good.
B) An increase in income for an inferior good.
C) A decrease in price
D) An increase in price
Correct Answer:
Verified
Q23: Use the following schedule of data
Q24: identify how the described changes will affect
Q25: identify how the described changes will affect
Q26: Reference: Consider the following graphs for the
Q27: Which of the following would cause a
Q29: Explain what occurs in a market when
Q30: Reference: Use the following graphs for the
Q31: Calculate the equilibrium quantity and price when
Q32: Which of the following BEST explains the
Q33: The market equilibrium price for widgets is
Unlock this Answer For Free Now!
View this answer and more for free by performing one of the following actions

Scan the QR code to install the App and get 2 free unlocks

Unlock quizzes for free by uploading documents