Reference: Use the following graphs for the following question 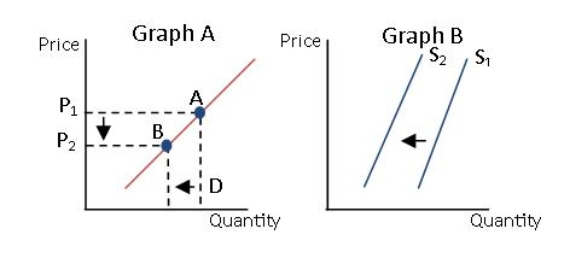
-Which of the following would best reflect Graph B?
A) An decrease in the costs of production
B) A decrease in the price of an alternative good that could be produced by the firm.
C) A decrease in the price of the good
D) A decrease in the number of sellers in the market
Correct Answer:
Verified
Q17: This represents the buyers' side of the
Q18: The inverse relationship between price and quantity
Q19: A movement along an existing demand curve
Q20: If a surplus exists in a market,
Q21: Which of the following best describes the
Q23: Use the following schedule of data
Q24: identify how the described changes will affect
Q25: identify how the described changes will affect
Q26: Reference: Consider the following graphs for the
Q27: Which of the following would cause a
Unlock this Answer For Free Now!
View this answer and more for free by performing one of the following actions

Scan the QR code to install the App and get 2 free unlocks

Unlock quizzes for free by uploading documents