In the figure below, which of the following are A to E likely to represent?
chronic lymphocyte leukemia; melanoma; medulloblastoma; microsatellite instability (MSI)-positive colorectal cancer; MSI-negative colorectal cancer. 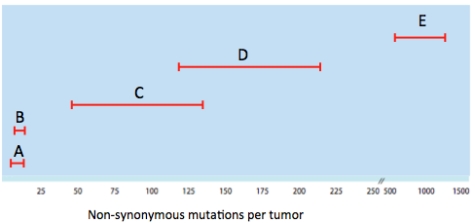
Correct Answer:
Verified
B) ...
View Answer
Unlock this answer now
Get Access to more Verified Answers free of charge
Q22: The range of different point mutation classes
Q23: Illustrate how some tumor suppressor genes are
Q24: Tumor recurrence is a major problem in
Q25: Illustrate how some tumor suppressor genes are
Q26: Give three examples of mechanisms that explain
Q28: Loci for previously unknown tumor suppressor genes
Q29: The number of mutations in a cancer
Q30: Tumor suppressor genes have been classified into
Q31: Match cancers
a) to
d) with one of the
Q32: What is the Philadelphia chromosome and why
Unlock this Answer For Free Now!
View this answer and more for free by performing one of the following actions

Scan the QR code to install the App and get 2 free unlocks

Unlock quizzes for free by uploading documents