The figure below shows the result of a price fixing scheme that raised price above competitive levels at point C to a price of $15 at point M. 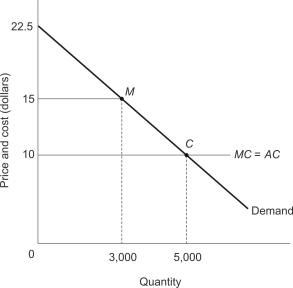 By forming this price-fixing cartel,producers gained $__________ of producer surplus,while consumers lost $__________ of consumer surplus.
A) $15,000; $10,000
B) $15,000; $20,000
C) $20,000; $10,000
D) $20,000; $5,000
Correct Answer:
Verified
Q27: A municipal water utility employs quasi-fixed
Q28: A municipal water utility employs quasi-fixed
Q29: The figure below shows the result of
Q30: A municipal water utility employs quasi-fixed
Q31: A municipal water utility employs quasi-fixed
Q33: A municipal water utility employs quasi-fixed
Q34: A municipal water utility employs quasi-fixed
Q35: The cost and demand conditions for residential
Q36: The cost and demand conditions for residential
Q37: The figure below shows the result of
Unlock this Answer For Free Now!
View this answer and more for free by performing one of the following actions

Scan the QR code to install the App and get 2 free unlocks

Unlock quizzes for free by uploading documents