The figure below shows the marginal damage and marginal abatement cost curves for sulfur dioxide emissions in North Zulch.EPA officials have imposed an emissions tax of $100 per ton of sulfur dioxide. 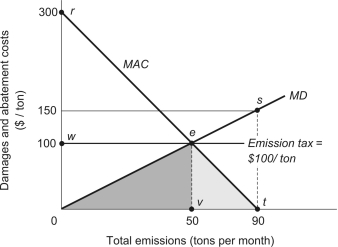 The optimal level of sulfur dioxide emission is not zero because it would cost $_______ to avoid or abate the last ton of pollution,while the benefit of abating the last ton is $_______.
A) $300; $100
B) $300; $0
C) $13,500; 6,750
D) $13,500; $0
Correct Answer:
Verified
Q36: The cost and demand conditions for residential
Q37: The figure below shows the result of
Q38: Use the figure below,which shows the linear
Q39: A municipal water utility employs quasi-fixed
Q40: _ is/are example(s)of market failure that could
Q42: Use the figure below,which shows the linear
Q43: The less accurate consumer information is about
Q44: Use the figure below,which shows the linear
Q45: When we say that market prices allocate
Q46: The figure below shows the marginal damage
Unlock this Answer For Free Now!
View this answer and more for free by performing one of the following actions

Scan the QR code to install the App and get 2 free unlocks

Unlock quizzes for free by uploading documents