The following graph shows the demands and marginal revenue in two markets,1 and 2,for a price discriminating firm along with total marginal revenue,MRT,and marginal cost. 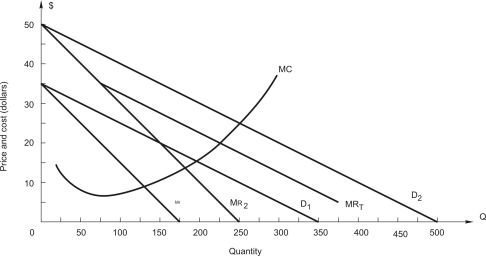 What total output should the firm produce?
A) 275 units
B) 225 units
C) 175 units
D) 350 units
E) 100 units
Correct Answer:
Verified
Q24: Refer to the following:
Q25: The following graph shows the demands and
Q26: A firm sells two goods (X
Q27: In order to maximize profit,a firm that
Q28: Refer to the following:
Q30: Gus has 20 acres of land in
Q31: Refer to the following:
Q32: A firm sells two goods (X
Q33: A firm is producing two goods
Q34: A firm is producing two goods
Unlock this Answer For Free Now!
View this answer and more for free by performing one of the following actions

Scan the QR code to install the App and get 2 free unlocks

Unlock quizzes for free by uploading documents