The following graph shows the demands and marginal revenue in two markets,1 and 2,for a price discriminating firm along with total marginal revenue,MRT,and marginal cost. 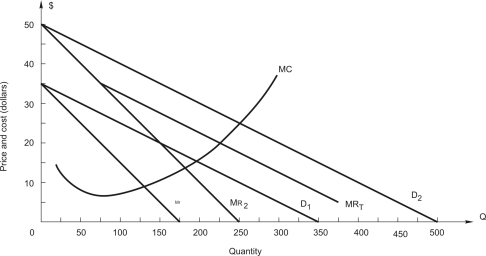 What price should the firm charge in each market?
A) P1 = $20,P2 = $32.50
B) P1 = $35,P2 = $22.50
C) P1 = $20,P2 = $20
D) P1 = $27.50,P2 = $35
E) Impossible to say because market demand is not given
Correct Answer:
Verified
Q16: A firm faces the demand for
Q17: A firm faces the demand for
Q18: A firm sells its product to two
Q19: In order to maximize profit,a firm that
Q20: A firm sells its product to two
Q22: In order to maximize profit,a firm producing
Q23: A firm sells two goods (X
Q24: Refer to the following:
Q25: The following graph shows the demands and
Q26: A firm sells two goods (X
Unlock this Answer For Free Now!
View this answer and more for free by performing one of the following actions

Scan the QR code to install the App and get 2 free unlocks

Unlock quizzes for free by uploading documents