The following figure shows the demand and cost curves facing a firm with market power in the short run. 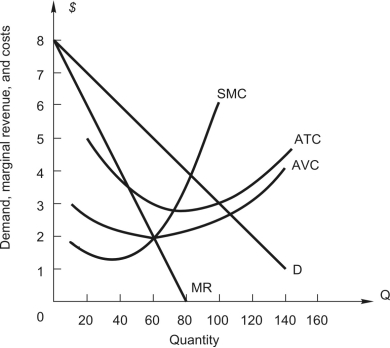 The profit-maximizing level of output is
A) 60 units.
B) 70 units
C) 80 units
D) 90 units.
E) 100 units.
Correct Answer:
Verified
Q9: Q10: Q11: Refer to the following table showing Q12: The following figure shows the demand and Q13: Monopolistic competition is similar to perfect competition Q15: Which of the following would indicate a Q16: Refer to the following figure showing demand Q17: Refer to the following table showing Q18: A monopoly is producing a level of Q19: A firm with market power![]()
![]()
A)can increase price
Unlock this Answer For Free Now!
View this answer and more for free by performing one of the following actions

Scan the QR code to install the App and get 2 free unlocks

Unlock quizzes for free by uploading documents