Multiple Choice
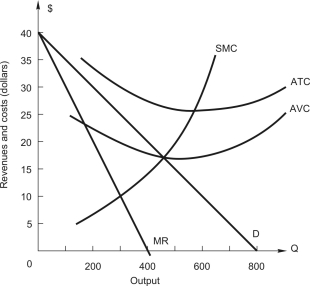 The figure above shows the demand and cost curves facing a price-setting firm.The profit-maximizing (or loss-minimizing) level of output is
A) 100
B) 200
C) 300
D) 400
E) 450
Correct Answer:
Verified
Related Questions
Q26: Which of the following is true of
Q27: Refer to the following table which
Q28: A firm with market power is producing
Q29: A monopolist will maximize profit by producing
Q30: Suppose that a profit-maximizing monopolist has a
Q32: Columns 1 and 2 make up
Unlock this Answer For Free Now!
View this answer and more for free by performing one of the following actions

Scan the QR code to install the App and get 2 free unlocks

Unlock quizzes for free by uploading documents