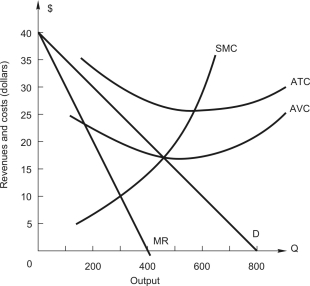
 The figure above shows the demand and cost curves facing a price-setting firm.In profit-maximizing (or loss-minimizing) equilibrium,the price-setting firm earns $______ in total revenue,which is ___________ the maximum possible total revenue of $________.
A) $7,500; equal to; $7,500
B) $8,000; more than; $7,500
C) $7,650; less than; $8,000
D) $8,000; equal to; $8,000
E) $7,500; less than; $8,000
Correct Answer:
Verified
Q16: Refer to the following figure showing demand
Q17: Refer to the following table showing
Q18: A monopoly is producing a level of
Q19: A firm with market power
A)can increase price
Q20: In a monopoly market,
A)other firms have no
Q22: A firm with market power will maximize
Q23: Columns 1 and 2 make up
Unlock this Answer For Free Now!
View this answer and more for free by performing one of the following actions

Scan the QR code to install the App and get 2 free unlocks

Unlock quizzes for free by uploading documents