The graph below shows demand and marginal cost for a perfectly competitive firm.If the firm is producing 300 units of output,decreasing output by one unit would ______ the firm's profit by $______. 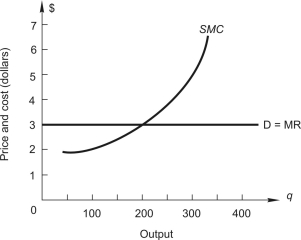
A) decrease,$2
B) increase,$2
C) increase,$3
D) decrease,$5
E) increase,$5
Correct Answer:
Verified
Q1: Which of the following is NOT a
Q2: Below,the graph on the left shows the
Q3: Below,the graph on the left shows the
Q4: In a perfectly competitive industry the market
Q5: Firm A and firm B both have
Q7: In a perfectly competitive market
A)a firm must
Q8: Below,the graph on the left shows the
Q9: Which of the following is NOT a
Q10: The graph on the left shows the
Q11: The total cost schedule for a
Unlock this Answer For Free Now!
View this answer and more for free by performing one of the following actions

Scan the QR code to install the App and get 2 free unlocks

Unlock quizzes for free by uploading documents