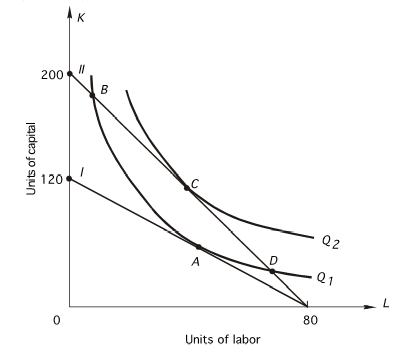
 In the above graph,the shift from I to II was due to
A) an increase in total cost.
B) an increase in the price of labor.
C) a decrease in the price of labor.
D) an increase in the price of capital.
E) a decrease in the price of capital.
Correct Answer:
Verified
Q59: In the following graph,the price of capital
Q60: In the following graph,the price of capital
Q61: A cow will produce 8500 lbs.of milk
Q62: In the graph below,the price of capital
Q63: If a firm is producing the level
Q65: In the graph below,the price of capital
Q66: In the graph below,the price of capital
Q67: If a firm is producing the level
Q68: Following is a firm's expansion path.The
Q69: Following is a firm's expansion path.The
Unlock this Answer For Free Now!
View this answer and more for free by performing one of the following actions

Scan the QR code to install the App and get 2 free unlocks

Unlock quizzes for free by uploading documents