The figure below shows a consumer maximizing utility at two different prices (the left panel) and the consumer's demand for good X at the same two prices of good X (the right panel) .The price of good Y is $14.When the price of X increases from point M to point N along the demand curve,it is clear that good X ___________ (is,is not) a Giffen good because _______________. 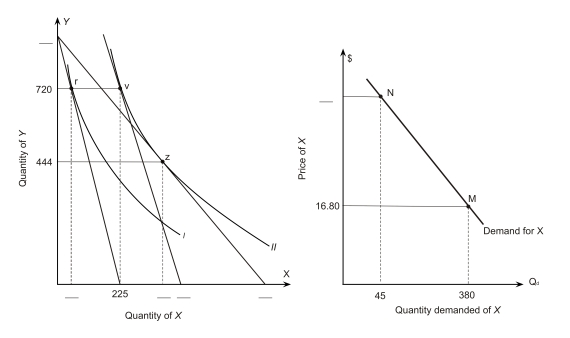
A) is; the total effect of the price increase is negative.
B) is; the income effect reinforces the substitution effect.
C) is; the income effect is larger than the substitution effect.
D) is not; the substitution effect reinforces the income effect.
E) is not; good X is an inferior good.
Correct Answer:
Verified
Q60: In the following graph the price
Q61: Refer to the following indifference map for
Q62: The figure below shows a consumer maximizing
Q63: The figure below shows a consumer maximizing
Q64: In the figure below,a consumer faces a
Q66: Refer to the following indifference map for
Q67: Refer to the following indifference map for
Q68: The figure below shows a consumer maximizing
Q69: The figure below shows a consumer maximizing
Q70: Assume James purchases only two goods,steak and
Unlock this Answer For Free Now!
View this answer and more for free by performing one of the following actions

Scan the QR code to install the App and get 2 free unlocks

Unlock quizzes for free by uploading documents