The figure below shows a consumer maximizing utility at two different prices (the left panel) and the consumer's demand for good X at the same two prices of good X (the right panel) .The price of good Y is $4.50.The equation of the budget line passing through point r is _______________. 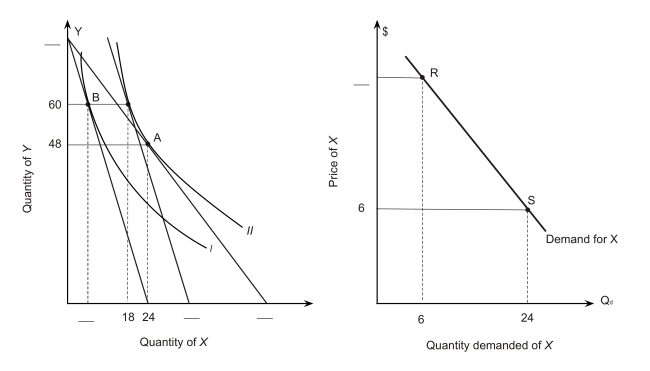
A) Y = 80 - (10/3) X
B) Y = 90 - (10/3) X
C) Y = 80 - 0.3X
D) Y = 90 - 0.3X
Correct Answer:
Verified
Q74: The market demand curve
A)shows how much all
Q75: The figure below shows a consumer maximizing
Q76: The figure below shows a consumer maximizing
Q77: The figure below shows a consumer maximizing
Q78: The figure below shows a consumer maximizing
Q80: The figure below shows a consumer maximizing
Q81: The following figure shows a portion of
Q82: The following figure shows a portion of
Q83: The following figure shows a portion of
Q84: In the following figure,a consumer faces a
Unlock this Answer For Free Now!
View this answer and more for free by performing one of the following actions

Scan the QR code to install the App and get 2 free unlocks

Unlock quizzes for free by uploading documents