The figure below shows a consumer maximizing utility at two different prices (the left panel) and the consumer's demand for good X at the same two prices of good X (the right panel) .The price of good Y is $4.50.When the price of X increases from point S to point R along the demand curve,$___________ of income must be temporarily given to the consumer to isolate the substitution effect. 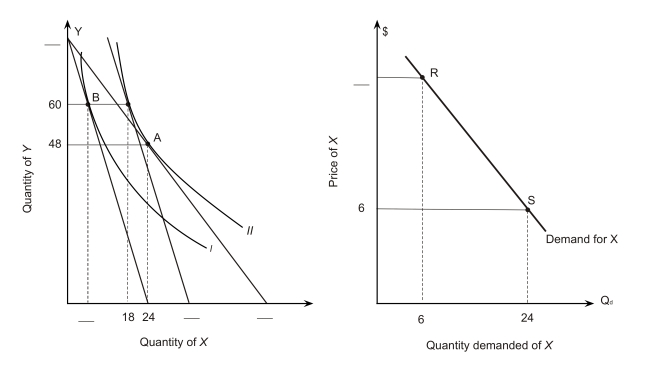
A) $175
B) $180
C) $200
D) $360
E) $400
Correct Answer:
Verified
Q94: The following figure shows a portion of
Q95: The following figure shows a portion of
Q96: The figure below shows a consumer maximizing
Q97: The following figure shows a portion of
Q98: A consumer has the indifference map shown
Q100: The following figure shows a portion of
Q101: A consumer has the indifference map shown
Q102: A consumer has the indifference map shown
Q103: A consumer has the indifference map shown
Q104: A consumer has the indifference map shown
Unlock this Answer For Free Now!
View this answer and more for free by performing one of the following actions

Scan the QR code to install the App and get 2 free unlocks

Unlock quizzes for free by uploading documents