In this figure, if the value of a calculated statistic falls in the ______ , you will ______. 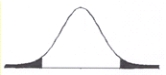
A) unshaded area; reject the null hypothesis
B) shaded area; reject the alternative hypothesis
C) shaded area; not reject the null hypothesis
D) unshaded area; not reject the null hypothesis
Correct Answer:
Verified
Q60: The "not equals" sign (≠) can be
Q61: _ refers to the probability of a
Q62: _ separates the regions of rejection and
Q63: Drawing distributions and shading in certain areas
Q64: In this figure, the unshaded area represents
Q66: _ is the value of a statistic
Q67: "The probability of a statistic needed to
Q68: The term "critical value" refers most specifically
Q69: The term "critical value" is used to
Q70: α refers to _.
A) the probability of
Unlock this Answer For Free Now!
View this answer and more for free by performing one of the following actions

Scan the QR code to install the App and get 2 free unlocks

Unlock quizzes for free by uploading documents