In this figure, the unshaded area represents ______. 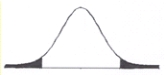
A) the values of a statistic with a high probability of occurring
B) alpha
C) the alternative hypothesis
D) the population mean
Correct Answer:
Verified
Q79: A 'critical value' _.
A) is the same
Q80: The difference between the regions of rejection
Q81: You _ when the statistic falls in
Q82: In this figure, the unshaded area represents
Q83: You will make the decision to _
Q85: In this figure, if the value of
Q86: You _ when the statistic falls in
Q87: You _ the null hypothesis when the
Q88: You _ when the statistic falls in
Q89: Hypothesis testing can provide _ for a
Unlock this Answer For Free Now!
View this answer and more for free by performing one of the following actions

Scan the QR code to install the App and get 2 free unlocks

Unlock quizzes for free by uploading documents