Exhibit 3-16
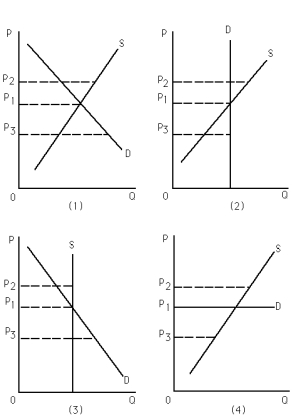
-Refer to Exhibit 3-16.Which of the following is false?
A) Graph (1) : There is a shortage of this good when the price is equal to P3.
B) Graph (2) : As supply increases, equilibrium quantity remains constant.
C) Graph (3) : As demand increases, equilibrium price remains constant.
D) Graph (4) : As supply changes, equilibrium price stays the same.
Correct Answer:
Verified
Q120: Exhibit 3-16 Q126: Which of the following is consistent with Q131: Consider a point on a market demand Q133: If potential buyers of good X expect Q137: In the supply-and-demand diagram of the market Q138: If price is on the vertical axis Q139: There are two universities,A and B,in a Q143: One point on a market supply curve Q145: Labor is a resource that is necessary Q159: Which of the following statements best represents
![]()
Unlock this Answer For Free Now!
View this answer and more for free by performing one of the following actions

Scan the QR code to install the App and get 2 free unlocks

Unlock quizzes for free by uploading documents