Multiple Choice
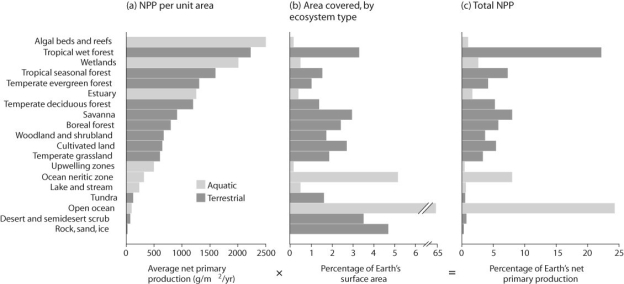 Figure 53.3
-In the figure above, how is net primary productivity represented?
A) organized by biome
B) organized by region
C) organized by geography
D) randomly organized
Correct Answer:
Verified
Related Questions
Q14: What is the main reason for using

