 Figure 52.7
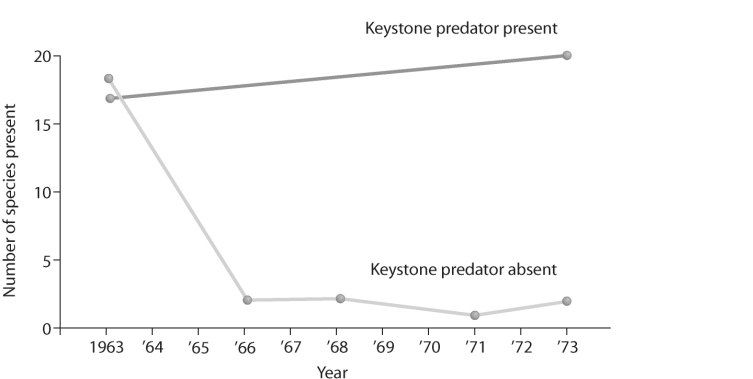
-What does the graph in the figure above tell you about the definition of a keystone species?
A) A keystone species added to a community can make it more robust.
B) A keystone species has little interaction with other species in an environment.
C) A keystone species removed from a community could have drastic effects.
D) A keystone species can be any species.
Correct Answer:
Verified
Q24: Q25: Q26: What is the main difference between a Q27: Q28: Which of the following is not an Q30: Q31: Elephants are not the most dominant species Q32: During a one year study, researchers found Q33: Which are the only two interaction types Q34: Unlock this Answer For Free Now! View this answer and more for free by performing one of the following actions Scan the QR code to install the App and get 2 free unlocks Unlock quizzes for free by uploading documents![]()
![]()
![]()
![]()
![]()

