 Figure 41.3
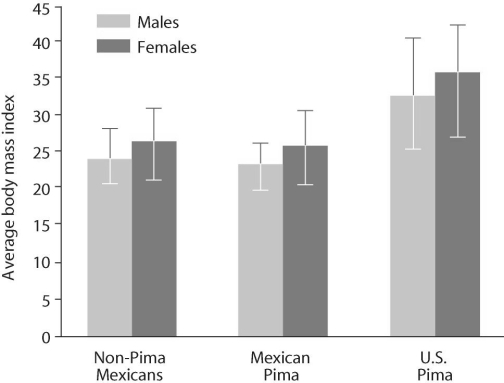
-Based on the graph in the Figure 41.3, what can you infer about the incidence of type II diabetes mellitus?
A) People who develop type II diabetes mellitus are typically diagnosed in childhood or adolescence.
B) If you maintain a normal body weight BMI < 25) , you will not get type II diabetes mellitus.
C) Obesity is a risk factor for development of type II diabetes mellitus.
D) The incidence of type II diabetes mellitus has increased in the past 10 years.
Correct Answer:
Verified
Q23: Why did scientists originally hypothesize that proteolytic
Q24: If there is a strong genetic link
Q25: Coprophagy benefits animals by allowing them to
A)
Q26: The stomach releases hydrochloric acid to create
Q27: Bile, which is synthesized in the liver
Q29: What should individuals who have their gallbladders
Q30: The stomach is highly acidic, creating a
Q31: Which of the following is a major
Q32: Helicobacter pylori is a bacterial organism that
Q33: Glucose is transported from the intestinal lumen
Unlock this Answer For Free Now!
View this answer and more for free by performing one of the following actions

Scan the QR code to install the App and get 2 free unlocks

Unlock quizzes for free by uploading documents