Figure 22.3
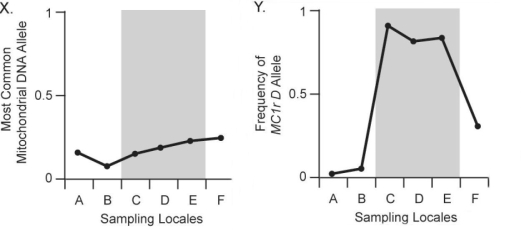
In Figure 22.3, chart X above shows the frequency of the most common neutral mitochondrial DNA allele an all gene that does not affect and is not linked to coat colour) across six pocket- mouse populations. Populations C, D and E live on dark volcanic rock; populations A, B, and F live on light- coloured granite. Compare this figure with chart Y above. What should you conclude after comparing these two figures?
A) The most common neutral mitochondrial DNA allele varies more among populations than the Mc1r D allele.
B) Little to no correlation exists between neutral mitochondrial DNA alleles and habitat colour.
C) The most common neutral mitochondrial DNA allele is strongly associated with the frequency of the Mc1r D allele.
D) The most common neutral mitochondrial DNA allele is strongly associated with substrate colour.
Correct Answer:
Verified
Q32: Evolution of antibiotic resistant bacteria represents which
Q33: Parasitic species tend to have simple morphologies.
Q34: A patient has finished his treatment for
Q35: Evolution by natural selection changes the population
Q36: Use the following information when answering the
Q37: According to the theory of evolution by
Q38: Use the following information when answering the
Q39: A population of rabbits grows explosively because
Q41: Fishers typically target the largest, and thus,
Q42: Which statement about transitional features is true?
A)
Unlock this Answer For Free Now!
View this answer and more for free by performing one of the following actions

Scan the QR code to install the App and get 2 free unlocks

Unlock quizzes for free by uploading documents