TABLE 13-11
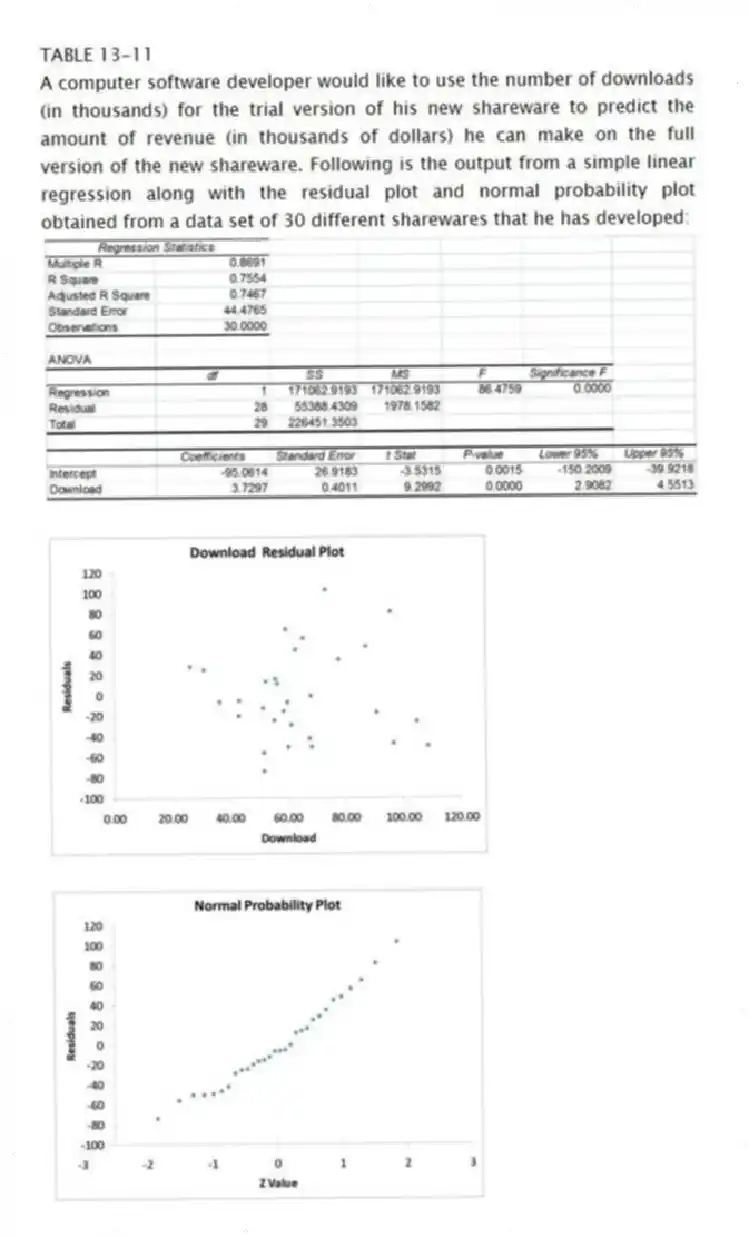
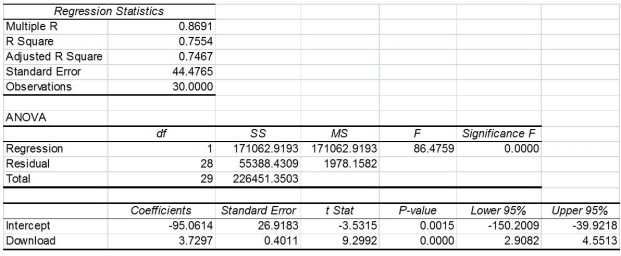
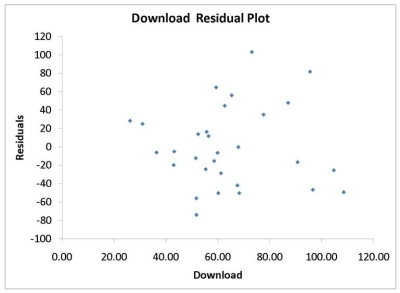
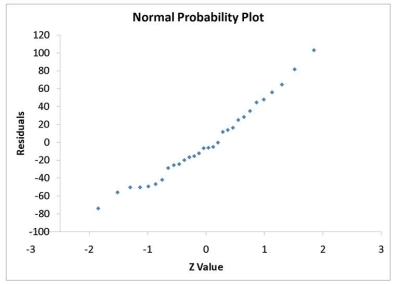
A computer software developer would like to use the number of downloads (in thousands) for the trial version of his new shareware to predict the amount of revenue (in thousands of dollars) he can make on the full version of the new shareware. Following is the output from a simple linear regression along with the residual plot and normal probability plot obtained from a data set of 30 different sharewares that he has developed:


-Referring to Table 13-11, which of the following is the correct interpretation for the coefficient of determination?
A) 74.67% of the variation in revenue can be explained by the variation in the number of downloads.
B) 75.54% of the variation in revenue can be explained by the variation in the number of downloads.
C) 74.67% of the variation in the number of downloads can be explained by the variation in revenue.
D) 75.54% of the variation in the number of downloads can be explained by the variation in revenue.
Correct Answer:
Verified
Q174: TABLE 13-11
A computer software developer would like
Q175: TABLE 13-11
A computer software developer would like
Q176: TABLE 13-11
A computer software developer would like
Q177: TABLE 13-11
A computer software developer would like
Q178: TABLE 13-11
A computer software developer would like
Q180: TABLE 13-11
A computer software developer would like
Q181: TABLE 13-12
The manager of the purchasing department
Q182: TABLE 13-12
The manager of the purchasing department
Q183: TABLE 13-12
The manager of the purchasing department
Q184: TABLE 13-12
The manager of the purchasing department
Unlock this Answer For Free Now!
View this answer and more for free by performing one of the following actions

Scan the QR code to install the App and get 2 free unlocks

Unlock quizzes for free by uploading documents