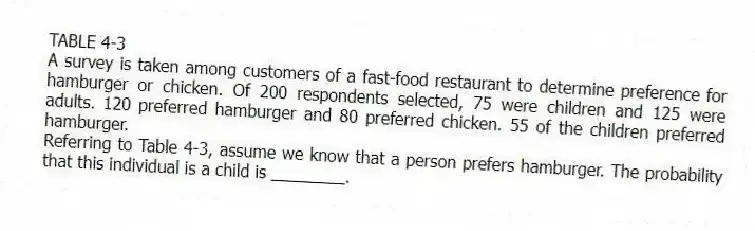
TABLE 4-3
A survey is taken among customers of a fast-food restaurant to determine preference for hamburger or chicken. Of 200 respondents selected, 75 were children and 125 were adults. 120 preferred hamburger and 80 preferred chicken. 55 of the children preferred hamburger.
-Referring to Table 4-3, assume we know that a person prefers hamburger. The probability that this individual is a child is ________.
Correct Answer:
Verified
Q89: TABLE 4-4
Suppose that patrons of a restaurant
Q90: TABLE 4-4
Suppose that patrons of a restaurant
Q91: TABLE 4-5
In a meat packaging plant, Machine
Q92: TABLE 4-6
At a Texas college, 60% of
Q93: TABLE 4-4
Suppose that patrons of a restaurant
Q95: TABLE 4-4
Suppose that patrons of a restaurant
Q96: TABLE 4-4
Suppose that patrons of a restaurant
Q97: TABLE 4-4
Suppose that patrons of a restaurant
Q98: TABLE 4-4
Suppose that patrons of a restaurant
Q99: TABLE 4-3
A survey is taken among customers
Unlock this Answer For Free Now!
View this answer and more for free by performing one of the following actions

Scan the QR code to install the App and get 2 free unlocks

Unlock quizzes for free by uploading documents