TABLE 3-8
The time period from 2006 to 2009 saw a great deal of volatility in the value of stocks. The data in the following table represent the total rate of return of our companies from 2006 to 2009.
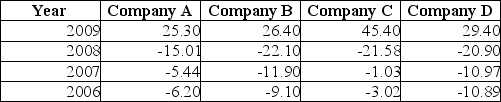
-Referring to Table 3-8, calculate the geometric mean rate of return for Company C.
Correct Answer:
Verified
Q121: TABLE 3-7
In a recent academic year, many
Q122: TABLE 3-9
The following table represents the assets
Q127: The rate of return for the S&P
Q128: TABLE 3-8
The time period from 2006 to
Q128: TABLE 3-7
In a recent academic year, many
Q129: The 12-month rate of returns over a
Q133: TABLE 3-7
In a recent academic year, many
Q135: TABLE 3-7
In a recent academic year, many
Q136: The Z score of an observation measures
Q139: TABLE 3-10
The population of eight analysts at
Unlock this Answer For Free Now!
View this answer and more for free by performing one of the following actions

Scan the QR code to install the App and get 2 free unlocks

Unlock quizzes for free by uploading documents