TABLE 2-4
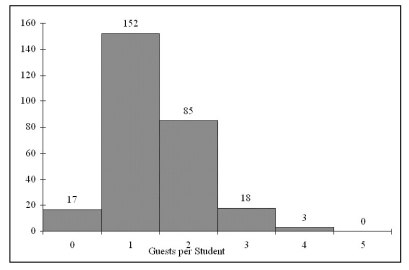
Every spring semester, the School of Business coordinates with local business leaders a luncheon for graduating seniors, their families, and friends. Corporate sponsorship pays for the lunches of each of the seniors, but students have to purchase tickets to cover the cost of lunches served to guests they bring with them. The following histogram represents the attendance at the senior luncheon, where X is the number of guests each graduating senior invited to the luncheon and f is the number of graduating seniors in each category.
-When constructing charts, the following is plotted at the class midpoints:
A) frequency histograms.
B) percentage polygons.
C) cumulative relative frequency ogives.
D) All of the above.
Correct Answer:
Verified
Q20: When polygons or histograms are constructed,which axis
Q32: Which of the following is appropriate for
Q44: TABLE 2-6
The following are the durations in
Q45: TABLE 2-5
A survey was conducted to determine
Q47: TABLE 2-5
A survey was conducted to determine
Q48: TABLE 2-6
The following are the durations in
Q50: TABLE 2-6
The following are the durations in
Q51: TABLE 2-6
The following are the durations in
Q53: TABLE 2-6
The following are the durations in
Q54: TABLE 2-6
The following are the durations in
Unlock this Answer For Free Now!
View this answer and more for free by performing one of the following actions

Scan the QR code to install the App and get 2 free unlocks

Unlock quizzes for free by uploading documents