TABLE 2-11
The histogram below represents scores achieved by 200 job applicants on a personality profile.
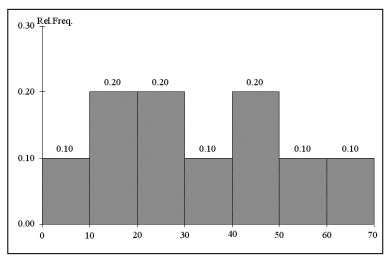
-Referring to the histogram from Table 2-11, the number of job applicants who scored between 30 and 60 is ________.
Correct Answer:
Verified
Q97: In constructing a polygon,each class grouping is
Q133: TABLE 2-9
The Stem-and-Leaf display represents the number
Q134: TABLE 2-9
The Stem-and-Leaf display represents the number
Q135: TABLE 2-11
The histogram below represents scores achieved
Q136: TABLE 2-11
The histogram below represents scores achieved
Q137: TABLE 2-12
The ordered array below resulted from
Q139: TABLE 2-10
The frequency distribution below represents the
Q140: TABLE 2-10
The frequency distribution below represents the
Q142: TABLE 2-12
The ordered array below resulted from
Q143: TABLE 2-12
The ordered array below resulted from
Unlock this Answer For Free Now!
View this answer and more for free by performing one of the following actions

Scan the QR code to install the App and get 2 free unlocks

Unlock quizzes for free by uploading documents