TABLE 2-17
The figure below is the percentage polygon for the amount of calories for a sample of 36 pizzas products where the upper limits of the intervals are: 310, 340, 370, 400 and 430.
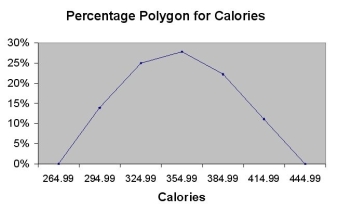
-Referring to Table 2-17, roughly what percentage of pizza products contains at least 340 calories?
A) 25%
B) 28%
C) 39%
D) 61%
Correct Answer:
Verified
Q265: TABLE 2-15
The table below contains the number
Q266: TABLE 2-16
The figure below is the ogive
Q267: TABLE 2-15
The table below contains the number
Q268: TABLE 2-16
The figure below is the ogive
Q269: TABLE 2-18
The following table presents total retail
Q271: TABLE 2-18
The following table presents total retail
Q272: TABLE 2-15
The table below contains the number
Q273: TABLE 2-18
The following table presents total retail
Q274: TABLE 2-17
The figure below is the percentage
Q275: TABLE 2-15
The table below contains the number
Unlock this Answer For Free Now!
View this answer and more for free by performing one of the following actions

Scan the QR code to install the App and get 2 free unlocks

Unlock quizzes for free by uploading documents