Figure 6.2
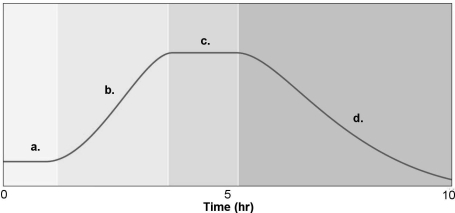
-Figure 6.2 shows a typical bacterial growth curve with the x- axis indicating the log of the number of bacteria and the y- axis indicating time in culture. In the figure, which sections of the graph illustrate a logarithmic change in cell numbers?
A) a and c
B) b and d
C) a and b
D) c and d
E) a and d
Correct Answer:
Verified
Q29: Which of the following is the best
Q30: Figure 6.2 Q31: Most bacteria grow best at pH Q32: The addition of which of the following Q33: Which of the following is an advantage Q35: Which of the following pairs is mismatched? Q36: During which growth phase will gram- positive Q37: Which enzyme catalyzes the reaction: 2H2O2 -2H2O Q38: Salts and sugars work to preserve foods Q39: Most bacteria reproduce by
![]()
A)1.
B)5.
C)7.
D)9.
E)14.
A)
A) budding.
B) aerial hyphae.
C)
Unlock this Answer For Free Now!
View this answer and more for free by performing one of the following actions

Scan the QR code to install the App and get 2 free unlocks

Unlock quizzes for free by uploading documents