Figure 6.4
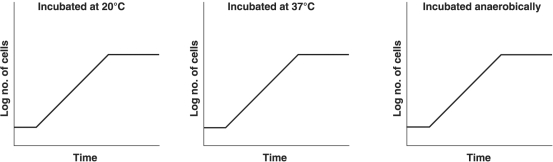
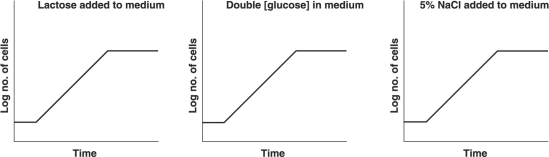
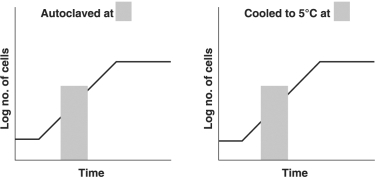
-In each graph in Figure 6.4, the culture was incubated at 30°C in glucose- minimal salts broth, aerobically. The bacterium is a facultative anaerobe with an optimum temperature of 37°C and can metabolize glucose and lactose. Indicate how each growth curve would change under the conditions indicated in each graph. Draw the new graphs, or write "no change."
Correct Answer:
Answered by Quizplus AI
View Answer
Unlock this answer now
Get Access to more Verified Answers free of charge
Q4: The biosafety level (BSL)for a clinical microbiology
Q42: Turbidity is an indirect measurement of bacterial
Q45: Laboratory cultivation of obligate anaerobes requires reducing
Q49: Table 6.2
The following data show growth
Q51: Three cells with generation times of 60
Q51: Agar is used as a solidifying agent
Q52: Pure cultures can easily be obtained on
Q56: An isolated colony on a streak plate
Q57: Nitrogen- fixing bacteria, such as cyanobacteria, can
Q58: Bacterial growth refers to an increase in
Unlock this Answer For Free Now!
View this answer and more for free by performing one of the following actions

Scan the QR code to install the App and get 2 free unlocks

Unlock quizzes for free by uploading documents