Figure 5.7
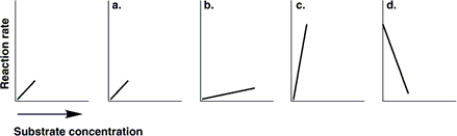
-The graph at the left in Figure 5.7 shows the reaction rate for an enzyme at its optimum temperature. Which graph shows enzyme activity at a higher temperature?
A) a
B) b
C) c
D) d
Correct Answer:
Verified
Q3: If a cell is starved for ATP,
Q4: Which of the following is the best
Q5: Which of the following statements about substrate-
Q6: Which of the following is the best
Q7: What is the fate of pyruvic acid
Q9: Which of the following statements regarding the
Q10: Which of the following statements regarding the
Q11: Which of the following is NOT necessary
Q12: Figure 5.6 Q13: A bacterial culture grown in a glucose-
![]()
Unlock this Answer For Free Now!
View this answer and more for free by performing one of the following actions

Scan the QR code to install the App and get 2 free unlocks

Unlock quizzes for free by uploading documents