Multiple Choice
Figure 14.3
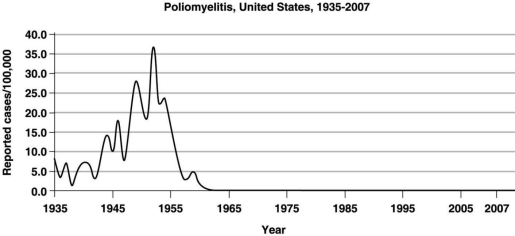
-The graph in Figure 14.3 shows the incidence of polio in the United States. The period between 1945 and 1955 indicates a(n)
A) endemic level.
B) sporadic infection.
C) pandemic.
D) communicable disease.
E) epidemic level.
Correct Answer:
Verified
Related Questions
Q36: Transient microbiota differ from normal microbiota in
Q37: Situation 14.1 is an example of
A) a
Q38: Which of the following is NOT a
Q39: The rise in herd immunity amongst a
Q40: A disease in which the causative agent
Q42: A nosocomial infection is
A) only a result
Unlock this Answer For Free Now!
View this answer and more for free by performing one of the following actions

Scan the QR code to install the App and get 2 free unlocks

Unlock quizzes for free by uploading documents