Using the figure below, which of the following best describes the titration curve? 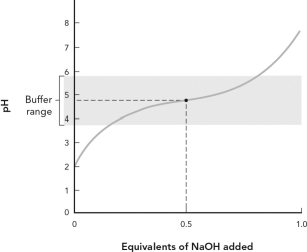
A) The equivalence point for the titration is pH = 7.
B) The midpoint of the titration is pH = 7.
C) The pKa for this weak acid is 4.76.
D) This is a titration of a weak base by NaOH.
Correct Answer:
Verified
Q61: A molecule with hydrophobic and hydrophilic properties
Q62: A solution of which of the following
Q64: You wish to prepare a solution with
Q72: The lateral mobility of lipids with membrane
Q73: The characteristic(s)of a phospholipid is/are that they
A)
Q74: The fluidity of a membrane depends on
A)
Q75: The endomembrane system is/are
A) an intracellular network
Q76: Which of the following are true about
Q78: Calculate
Q79: How are polar molecules like glucose transported
Unlock this Answer For Free Now!
View this answer and more for free by performing one of the following actions

Scan the QR code to install the App and get 2 free unlocks

Unlock quizzes for free by uploading documents