Exhibit 31-2 -Refer to Exhibit 31-2.This Graph Represents a Positive Externality Situation.Given
Exhibit 31-2
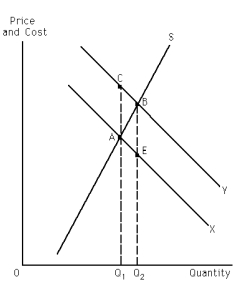
-Refer to Exhibit 31-2.This graph represents a positive externality situation.Given this,which of the two curves,X or Y,represents marginal social benefits and why?
A) Curve X, because if there is a positive externality, negative external benefits are associated with it: social costs external benefits - private benefits, therefore the marginal social benefit curve must lie below the marginal private benefit curve.
B) Curve X, because if there is a positive externality, external benefits are associated with it: social benefits = external benefits + private benefits, therefore the marginal social benefit curve must lie below the marginal private benefit curve.
C) Curve Y, because if there is a positive externality, external costs are associated with it: social benefits = external costs + private benefits, therefore the marginal social benefit curve must lie above the marginal private benefit cost curve.
D) Curve Y, because if there is a positive externality, external benefits are associated with it: social benefits = external benefits + private benefits, therefore the marginal social benefit curve must lie above the marginal private benefit curve.
Correct Answer:
Verified
Q34: Exhibit 31-2 Q37: Exhibit 31-2 Q43: Which of the following statements is true? Q49: When negative externalities are involved, the market Q51: Suppose the production of a good results Q53: When a positive externality exists, Q57: Samantha is given a flu shot by Q59: An externality is internalized if Q76: If the consumption of a good by Q77: Which of the following statements is true?
![]()
![]()
A)When
A)external benefits are
A)the person(s) or
A)A
Unlock this Answer For Free Now!
View this answer and more for free by performing one of the following actions

Scan the QR code to install the App and get 2 free unlocks

Unlock quizzes for free by uploading documents