 Figure 42.3
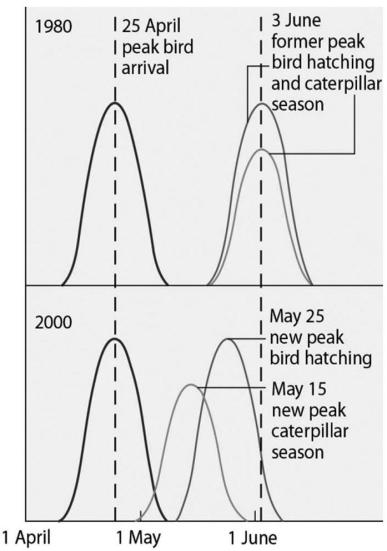
Use the graph in Figure 43.3 and the information provided in the paragraph below to answer the following questions.
Flycatcher birds that migrate from Africa to Europe feed their nestlings a diet that is almost exclusively moth caterpillars.The graph in Figure 43.3 shows the mean (peak) dates of bird arrival,bird hatching,and caterpillar season for the years 1980 and 2000.
-The shift in the peak of caterpillar season between 1980 and 2000 is most likely due to
A) pesticide use in the area.
B) earlier flycatcher migration.
C) global climate change.
D) acid precipitation in Europe.
Correct Answer:
Verified
Q43: Please use the following information to answer
Q44: What causes extremely high levels of toxic
Q45: Which of the following best explains the
Q46: Agricultural lands frequently require nutrient augmentation because
A)pesticide
Q47: Which of the following best illustrates human
Q49: Why were ecologists concerned about the shift
Q50: Suppose you attend a town meeting at
Q51: Which of the following best illustrates the
Q52: The use of DDT as an insecticide
Q53: Which of the following is the most
Unlock this Answer For Free Now!
View this answer and more for free by performing one of the following actions

Scan the QR code to install the App and get 2 free unlocks

Unlock quizzes for free by uploading documents