Please use the following information to answer the question(s) below.
The eight climographs in Figure 40.1 show yearly temperature (line graph and left vertical axis) and precipitation (bar graph and right vertical axis) averages for each month for some locations on Earth.Choose the climograph that best answers the question.
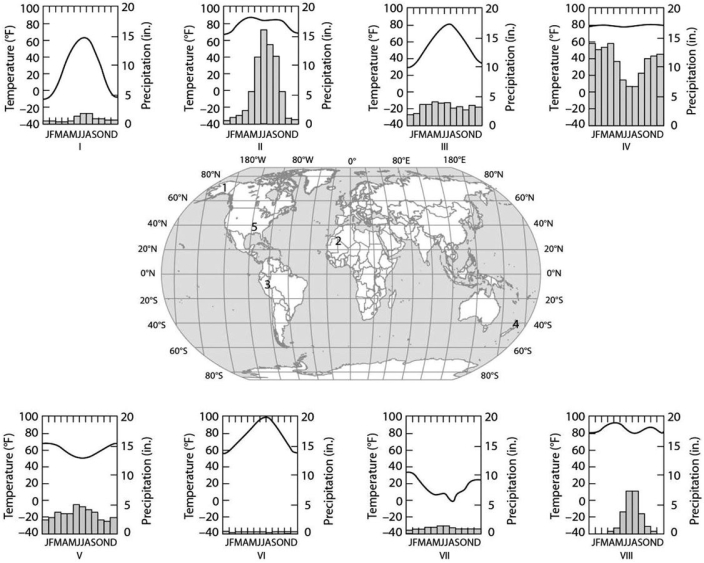 Figure 40.1
-Which climograph shows the climate for location 4?
A) I
B) II
C) III
D) V
E) VI
Correct Answer:
Verified
Q45: Why do populations grow more slowly as
Q50: Use the survivorship curves in Figure 53.1
Q74: In which of the following situations would
Q75: Please use the following information to answer
Q77: What is a metapopulation?
A)all of the populations
Q78: Q80: Figure 40.2 shows a generalized cross section Q82: A population's carrying capacity![]()
A)may change as environmental
Unlock this Answer For Free Now!
View this answer and more for free by performing one of the following actions

Scan the QR code to install the App and get 2 free unlocks

Unlock quizzes for free by uploading documents