The figure below provides data for measles deaths and vaccinations.What can you conclude from these data? 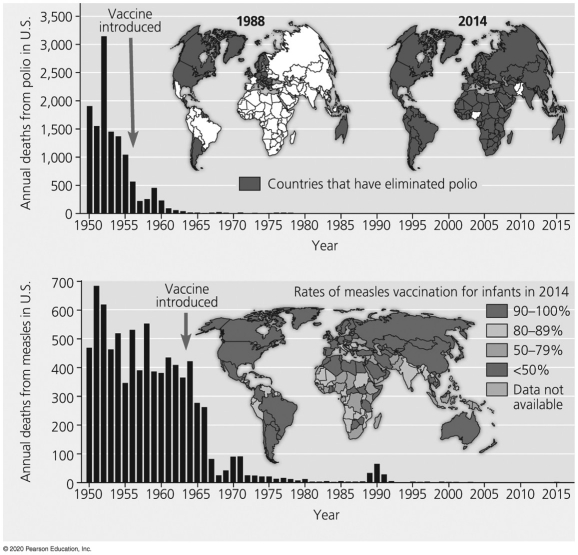
A) The spike in measles deaths in 1990 was due to a lack of vaccinations.
B) The rate of measles vaccinations increased between 1970 and 2015.
C) Measles vaccination rates are the lowest in African countries.
D) Measles deaths decreased between 1950 and 1960 due to the use of the measles vaccine.
Correct Answer:
Verified
Q86: An epitope associates with which part of
Q86: Use the following information to answer the
Q87: According to the graph,B cells will first
Q89: Fruit flies normally produce two types of
Q90: Fruit flies normally produce two types of
Q91: Which of these is not part of
Q93: Which of the following statements is not
Q94: Fruit flies normally produce two types of
Q95: According to Figure 35.5,approximately when did a
Q100: Use the following information to answer the
Unlock this Answer For Free Now!
View this answer and more for free by performing one of the following actions

Scan the QR code to install the App and get 2 free unlocks

Unlock quizzes for free by uploading documents