 Figure 5.4
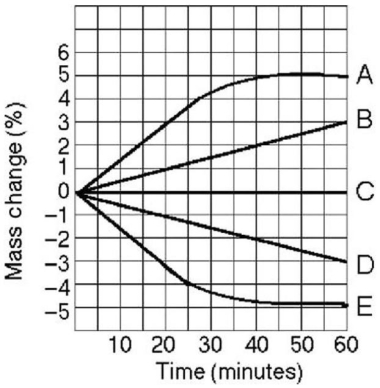
-Five dialysis bags,constructed from a semipermeable membrane that is impermeable to sucrose,were filled with various concentrations of sucrose and then placed in separate beakers containing an initial concentration of 0.6 M sucrose solution.At 10-minute intervals,the bags were massed (weighed) ,and the percent change in mass of each bag was graphed.Figure 5.4 illustrates the change in the mass of the bags over time.Which line in the graph represents the bag that contained a 0.6 M solution at the beginning of the experiment?
A) A
B) B
C) C
D) D
E) E
Correct Answer:
Verified
Q59: The difference between pinocytosis and receptor-mediated endocytosis
Q60: Phosphatase enzymes in signal transduction pathways function
Q61: Theoretically,how might researchers disrupt signal transduction pathways
Q62: Binding of the signaling molecule epinephrine to
Q63: An accident victim has lost a lot
Q65: An accident victim has lost a lot
Unlock this Answer For Free Now!
View this answer and more for free by performing one of the following actions

Scan the QR code to install the App and get 2 free unlocks

Unlock quizzes for free by uploading documents