Figure 9-1
This figure shows the effect of a minimum-wage law. 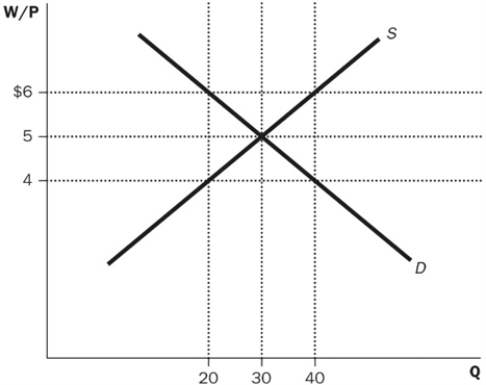
-Refer to Figure 9-1. Which of the following describes the equilibrium point in the diagram where there is an absence of the minimum-wage law?
A) $4 and 20 workers
B) $5 and 30 workers
C) $5 and 40 workers
D) $6 and 40 workers
Correct Answer:
Verified
Q102: If the minimum wage was currently above
Q103: Typically, how much more do union members
Q104: What impact do employment insurance and unions
Q105: What is the effect of minimum-wage laws
Q106: Which statement best defines collective bargaining?
A) It
Q108: Which condition causes structural unemployment?
A) Wages are
Unlock this Answer For Free Now!
View this answer and more for free by performing one of the following actions

Scan the QR code to install the App and get 2 free unlocks

Unlock quizzes for free by uploading documents