Multiple Choice
Figure 4-7 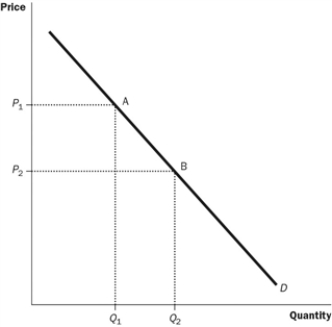
-Refer to the Figure 4-7. What does the movement from point B to point A on the graph show?
A) a decrease in demand
B) an increase in demand
C) a decrease in quantity demanded
D) an increase in quantity demanded
Correct Answer:
Verified
Related Questions
Q88: Figure 4-6 Q89: Peterborough is a small university city in![]()

