Figure 4-8 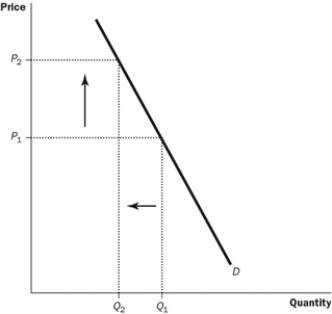
-Refer to the Figure 4-8. The graph shows the demand for cigarettes. Which most likely happened?
A) The price of marijuana rose.
B) Mandatory health warnings were placed on cigarette packages.
C) Several foreign countries banned Canadian cigarettes in their countries.
D) A tax was placed on cigarettes.
Correct Answer:
Verified
Q110: Other things equal, what happens when the
Q111: What does the market supply curve show?
A)
Q112: For a seller, which of the following
Q113: Which of the following determines a market
Q114: For teens, what does a 10 percent
Q116: Most studies indicate that low cigarette prices
Q117: How is a market supply curve constructed?
A)
Q118: What does fewer sellers in the market
Q119: What might cause a movement along the
Q120: What is the relationship between price and
Unlock this Answer For Free Now!
View this answer and more for free by performing one of the following actions

Scan the QR code to install the App and get 2 free unlocks

Unlock quizzes for free by uploading documents