Multiple Choice
Figure 4-9 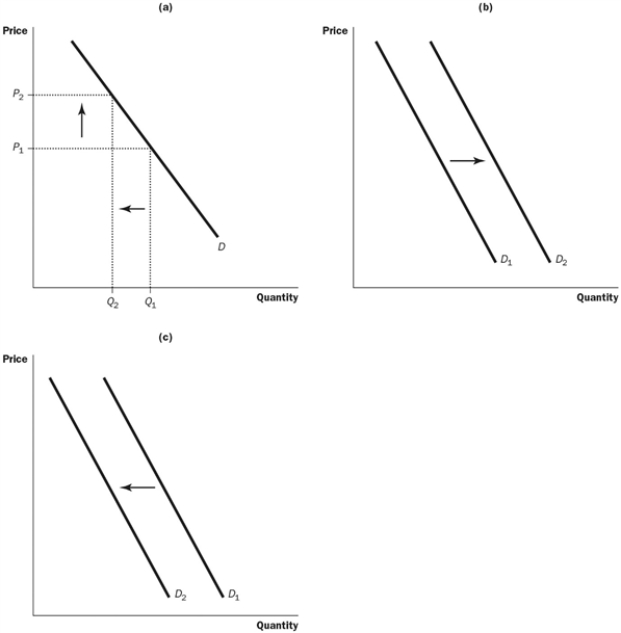
-Refer to the Figure 4-9. Which graph could be used to show the result of 5 percent of the country's smokers deciding to stop smoking?
A) graph a
B) graph b
C) graph c
D) both a and c could be used to show the result
Correct Answer:
Verified
Related Questions
Q97: What will happen to the demand curve
Q98: What would result from an increase in
Q99: What happens when the price of a
Unlock this Answer For Free Now!
View this answer and more for free by performing one of the following actions

Scan the QR code to install the App and get 2 free unlocks

Unlock quizzes for free by uploading documents