Multiple Choice
Figure 4-5 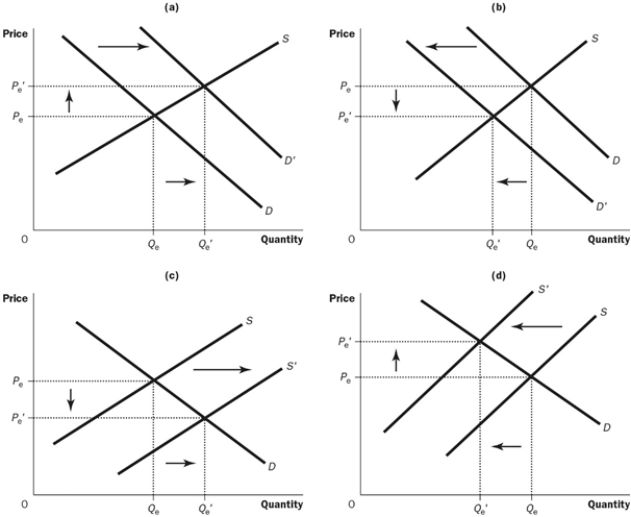
-Refer to the Figure 4-5. Which of the four graphs represents the market for strawberries after new technology is introduced that helps speed up the harvesting time?
A) graph A
B) graph B
C) graph C
D) graph D
Correct Answer:
Verified
Related Questions
Q173: If a shortage exists in a market,
Q174: What is step one in the three-step
Q175: What happens when there is a surplus
Q176: Suppose cupcakes are currently selling for $12
Q177: Which of the following is NOT one
Q179: If a surplus exists in a market,
Unlock this Answer For Free Now!
View this answer and more for free by performing one of the following actions

Scan the QR code to install the App and get 2 free unlocks

Unlock quizzes for free by uploading documents