Multiple Choice
Figure 4-5 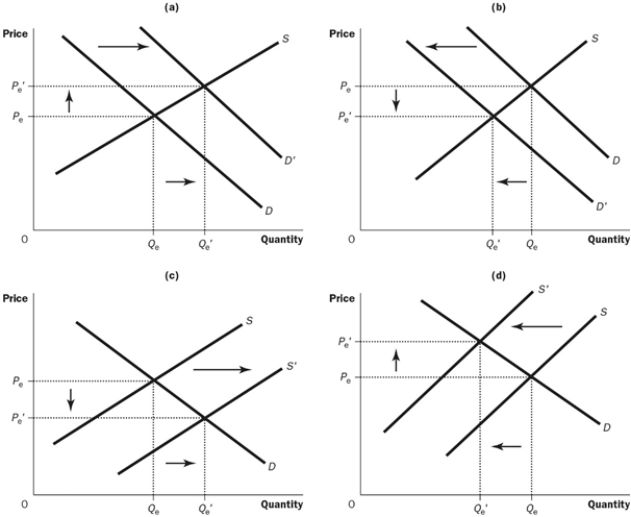
-Refer to the Figure 4-5. Which of the four graphs shown illustrates a decrease in quantity supplied?
A) graph A
B) graph B
C) graph C
D) graph D
Correct Answer:
Verified
Related Questions
Q185: Which of the following will definitely cause
Q186: Suppose that the incomes of buyers in
Q187: If the demand for a product decreases,
Q188: Suppose there is an earthquake that destroys
Q189: Which chain of events is listed in
Q191: What would an early frost in the
Q192: If the supply of a product decreases,
Unlock this Answer For Free Now!
View this answer and more for free by performing one of the following actions

Scan the QR code to install the App and get 2 free unlocks

Unlock quizzes for free by uploading documents